GuideHow to read the crypto market map
The market map is the whole crypto market on one screen. This guide explains what you see on it and how to use it, with real months from history.
What is on the dome?
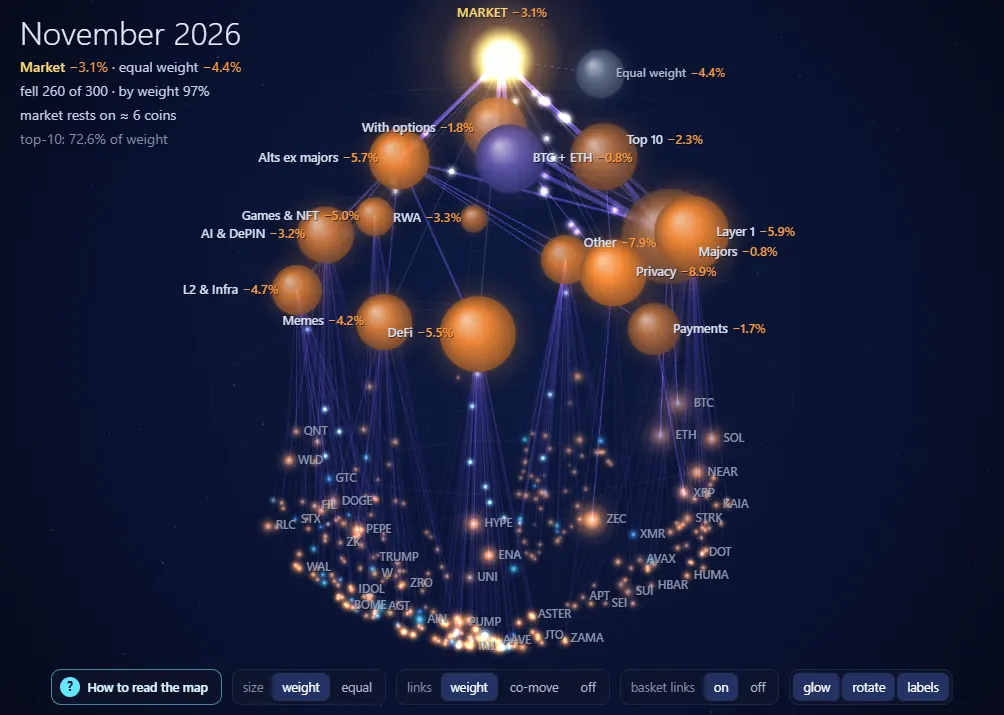
- The sun on top is the whole market for the chosen month. The small grey planet beside it is the same market with every coin given equal weight.
- Balls are sectors (Layer 1, DeFi, Memes and others). Purple links lead to baskets that overlap: Top 10, BTC + ETH, Alts ex majors, With options.
- Dots on the lower arc are coins, the largest ones signed.
- Colour and size. Blue means up, orange means down. Brighter means a stronger move for that month, bigger means more weight in the market.
How do I tell whether breadth or a few coins carry the market?
Look at the top left corner. Three lines answer the question: the market against equal weight, “N of M fell” and “rests on N coins”.
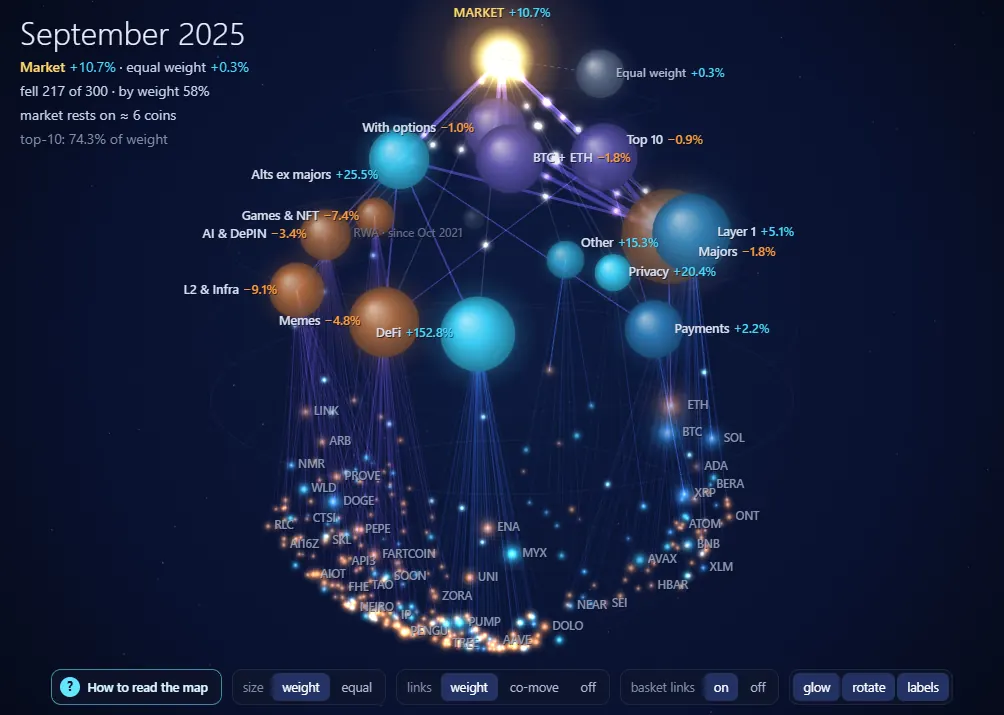
September 2025 is a narrow rise. The market gained +10.7%, equal weight only +0.3%, and 217 of 300 coins fell. One coin, MYX, with a weight of 1.0%, moved +1164% and gave the market about 11.9 points by itself.
November 2024 is a broad rise. The market gained +51.1%, equal weight +64.0%, and only 11 of 300 coins fell. When equal weight leads and almost nothing falls, the rise rests on many coins.
How do I look at any month?
The strip under the dome is the market over its whole history, 111 months from September 2017. Drag along it, press a month or press ▶: 1, 2 or 4 months per second. On a keyboard ← → change the month, Shift a year, space plays, F opens the full screen.
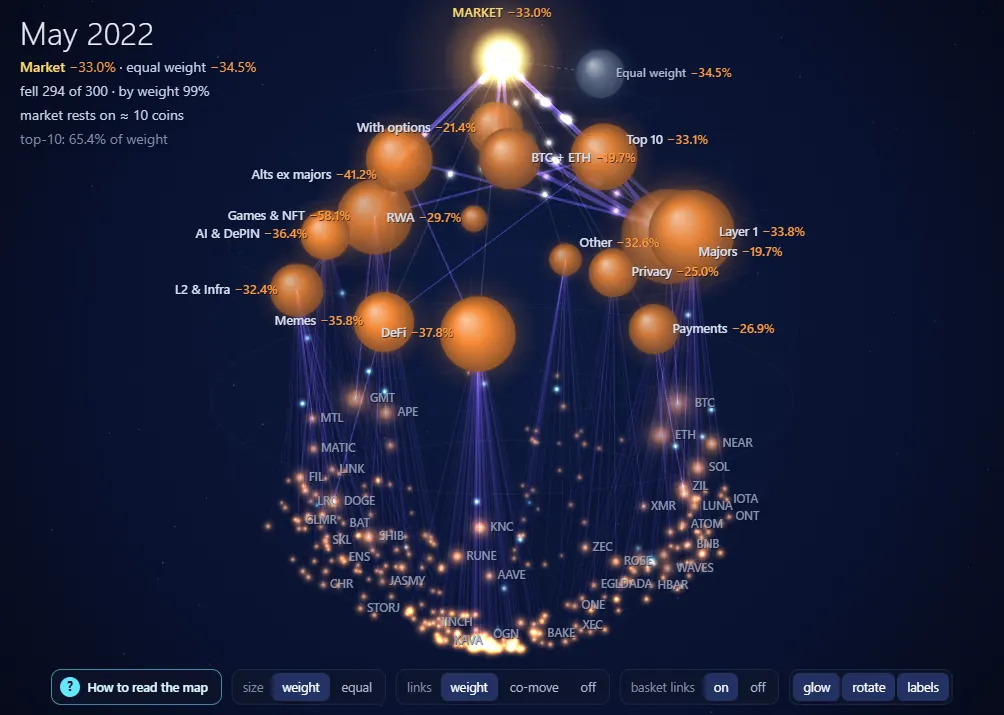
May 2022 is a fall of almost everything: the market −33.0%, equal weight −34.5%, 294 of 300 coins fell. Each month holds only the coins that existed then, so a coin listed later is not in the past. A basket that did not exist yet is grey and says from which month it exists.
What are the coin panel and options for?
Press a coin to see its month, weight and place, and for the current month its price, volume, open interest, funding, order book and liquidations. Coins with real options also show Put/Call, volatility, skew, max pain, the largest strikes and gamma levels. “Open chart” takes you to the terminal.
What is the weather?
The panel on the right shows the background: BTC and ETH option volatility, near against far volatility, Put/Call and Market Breadth. None of these series has shown the market's direction in advance: they tell you how restless things are.
What is the cone and the 80% corridor?
The yellow line is the market over a year, the fan is the corridor ahead for 2 weeks, 1, 3 or 6 months. Past months show where the market came out and whether it stayed inside. Coverage was checked forward in time, so here are the real numbers:
| Term | Inside the corridor | Months checked |
|---|---|---|
| 2 weeks | 79.8% | 109 |
| 1 month | 79.8% | 109 |
| 3 months | 79.4% | 107 |
| 6 months | 74.0% | 104 |
It is no promise: about one outcome in five falls outside, more often for 6 months.
How does the scenario work?
Pick a sector or a basket and a shock from −30 to +30. The element and its coins light up, the path to the market glows and the rest fades.
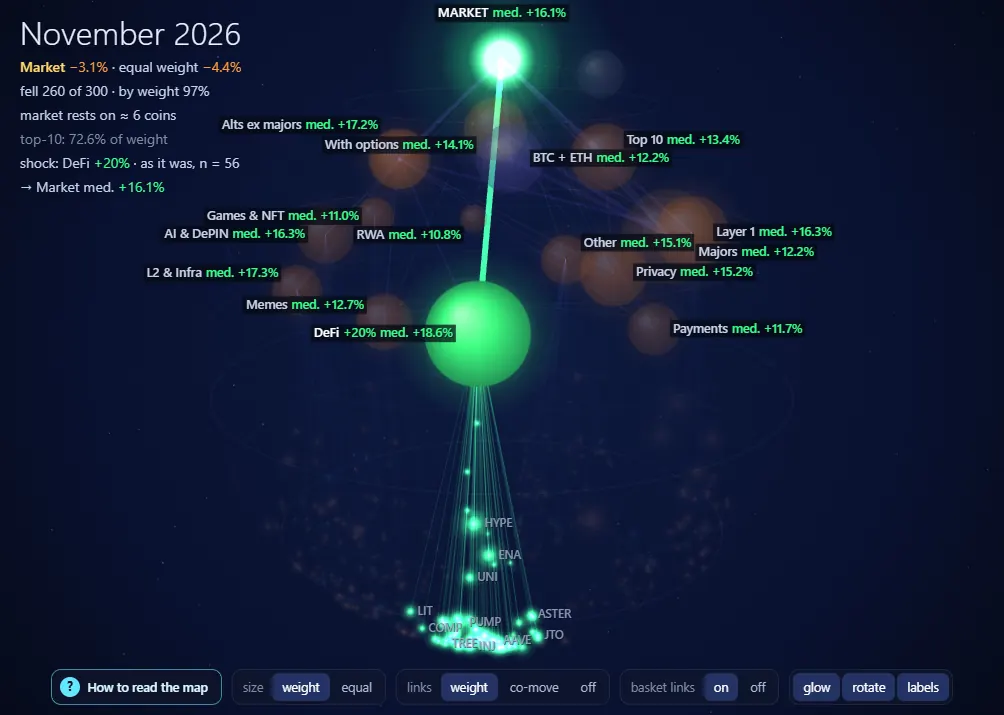
- “Grows alone” is pure mechanics: only the coins of this element move. DeFi holds 7.9% of the market, so DeFi +20 moves the market by +1.6%.
- “As it was” finds 21-day windows in history with such a move, shown before the chosen month only. DeFi +20 gives 56 episodes: the median of DeFi itself is +18.6%, the median of the market +16.1%. For comparison, in all windows the market median is +0.5%, and it was better than +5% in 40% of them.
- A joint move, not a cause. Coins usually move together, so the market median here is not what DeFi did to the market. With fewer than 5 episodes the page says so.
Open the map and press “How to read the map”: the same steps, right on the dome.Free forever — this is not a trial. Sign-up takes a minute, no card required.
Questions and answers
Is the market map free?
Yes. The dome, the strip, the cone and the scenario are open without sign-up. Weather rows and the coin's order book and options run a day late without a plan.
Does the map say where the price will go?
No. It shows how the market is built now and what happened before. It gives no advice to buy or sell.
Why is the top 10 so heavy?
Because the largest coins hold most of the market: in October 2026 the top 10 held 73.0% of the weight. Equal weight is next to the market for this very reason.