Binance and other exchanges · liveLiquidation heatmaps
Where leveraged longs and shorts on Binance and other exchanges get liquidated, level by level — in real time, free and without sign-up. Pick a coin.
As of 00:02, October 10, 2026 UTC:
BTC 82,636 · long liquidations within 5%: $46.6M · short liquidations within 5%: $146M
ETH 2,487.7 · long liquidations within 5%: $65.1M · short liquidations within 5%: $114M
SOL 109.13 · long liquidations within 5%: $13.4M · short liquidations within 5%: $41.3M
Bitcoin
BTC—Ethereum
ETH—Solana
SOL—The map is free. A free account adds what stands behind it: alerts on these levels, stop orders and take-profits on the same map, whales and the owners of walls, deeper history and trading from the chart.Free forever — this is not a trial. Sign-up takes a minute, no card required.
What the map shows
- Liquidation levelsThe prices where leveraged longs and shorts are force-closed, with the dollar amount at every level.
- Two days of historyHow each cluster grew and which ones the price has already taken.
- Levels right nowThe latest snapshot as bars by price: what stands below the price and what stands above it.
- Largest clustersThe biggest levels on both sides of the price with their amounts.
The same map on the BTC chart
In the terminal the map lies over the price chart next to the other indicators: you see how each cluster was built and what the price did when it came there.
Open the BTC chart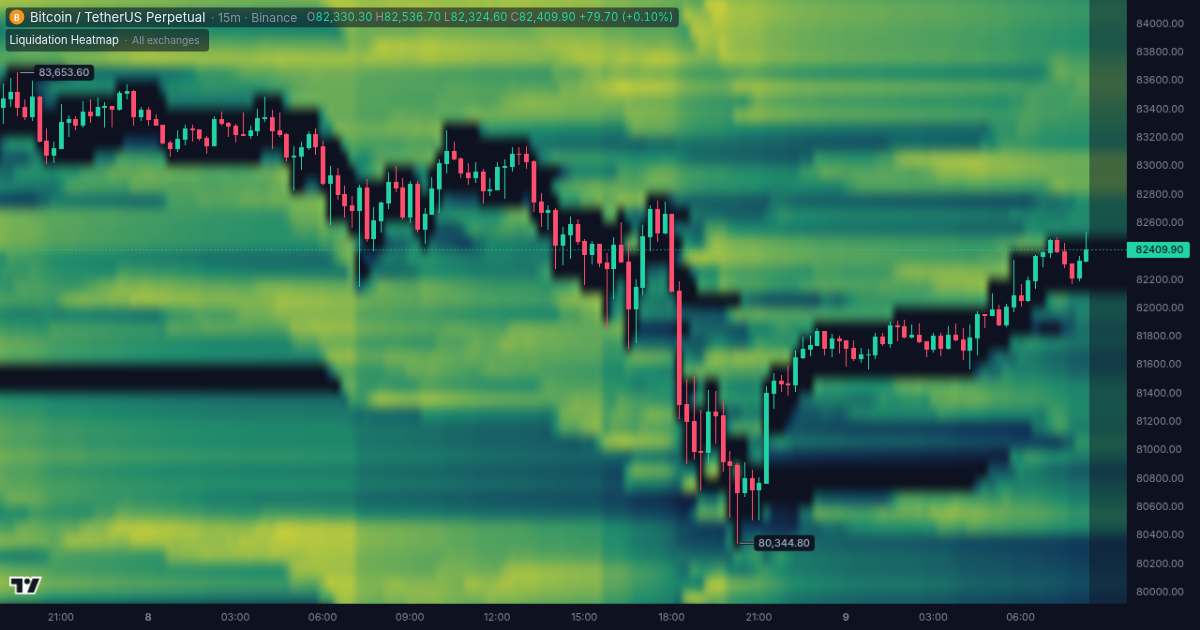
Questions and answers
What does a liquidation heatmap show?
The price levels where leveraged longs and shorts on Binance and other exchanges are force-closed. The brighter the band, the more money stands at the level.
How fresh is the heatmap?
It is live: the heatmap updates every few minutes and keeps the last two days.
Is the liquidation heatmap free?
Yes. The map is free and needs no sign-up. A free account adds alerts on these levels, stop orders and take-profits on the same map, whales and deeper history.
Which coins have a liquidation heatmap?
Bitcoin, Ethereum and Solana.