Liquidation heatmap · 2026Crypto liquidation heatmap: how to read it and where to see it free
Updated November 9, 2026
On the night of November 9, bitcoin fell from $75,565 to $73,333 in fifteen minutes. In one hour, $644M of positions were force-closed across the crypto market. The evening before, the liquidation map already showed where that fuel was: right below the price, from $75,050 down. Here is how to read such a map, how the popular tools differ, and where to see it free, with no sign-up.
Key takeaways
- A liquidation map shows the prices where exchanges will force-close leveraged longs and shorts, and how much money stands at each price.
- Clusters below the price are long liquidations; clusters above are short liquidations. What matters is not one bright band but the imbalance: where there is more money and where it is closer.
- A cluster does not pull the price by itself. But once the price walks into it, forced closes fire at once and speed the move up.
- Look at the whole market, not one exchange: on November 8, Hyperliquid and the other exchanges told different stories.
- On Liqwall, the Hyperliquid liquidation map for 61 markets, the map by exchange and the liquidation heatmaps open with no sign-up, and for the first 3 days after sign-up the whole terminal is free. CoinGlass's full heatmap costs $28 a month, Hyblock's liquidation levels $99, The Kingfisher from $79.
What a liquidation map is
A liquidation is a forced close of a position when the margin can no longer carry the loss. The higher the leverage, the closer that price sits to the entry: at 10x a position survives a move against it of a little under 10%, at 50x a little under 2%.
Every liquidation is a market order. A liquidated long sells; a liquidated short buys. When thousands of such positions sit at one price, that price holds fuel: when the price gets there, the orders fire all at once.
A liquidation map shows those places: bands by price with a dollar amount on each.
How to read a liquidation map: a live example
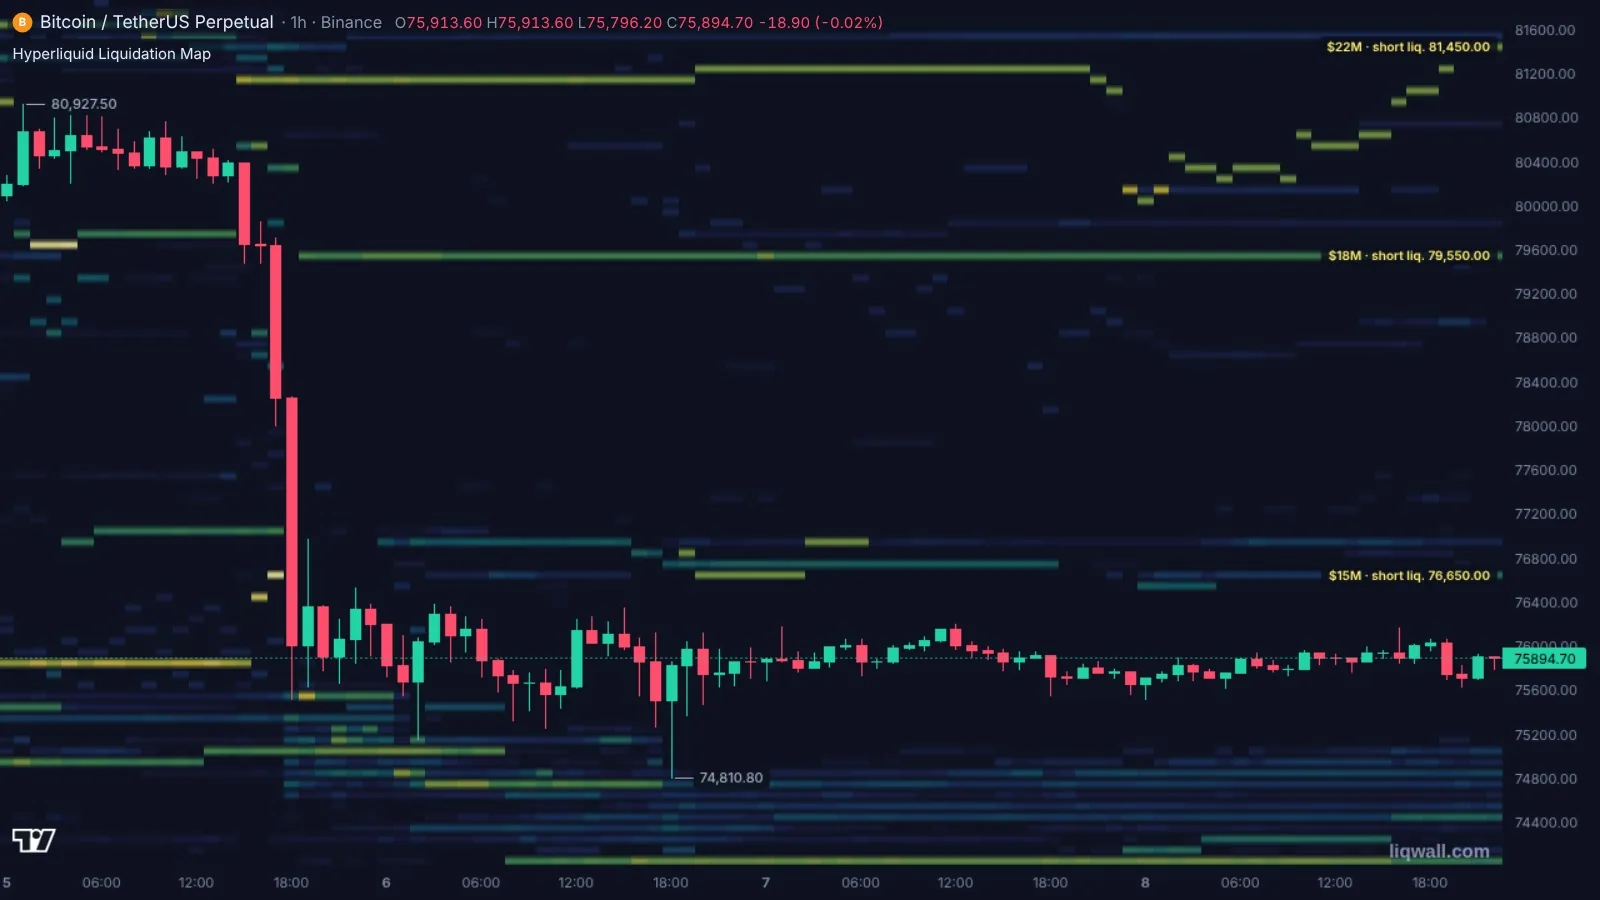
On the evening of November 8, bitcoin stood at $75,900. Here is what the Hyperliquid map showed:
- within 2% below the price — $60M of long liquidations; within 2% above — $31M of short liquidations;
- within 10% below — $425M of longs; within 10% above — $137M of shorts;
- the nearest dense levels — longs at $75,050, $74,850 and $74,450; shorts at $76,650.
Read it in three steps.
- Find the brightest bands above and below the price. Brightness is size: the lighter the band, the more money gets closed at that price.
- Compare the sides. Here there were twice as many longs below the price as shorts above it, and they were closer. If sellers pushed through $75,000, the sales of liquidated longs would meet them, and the drop would get fuel.
- Check how the cluster was built. The heatmap keeps history. A band that has stretched for three days and grows brighter is positions traders keep adding. A band the price has reached fades: those positions are closed.
What happened next
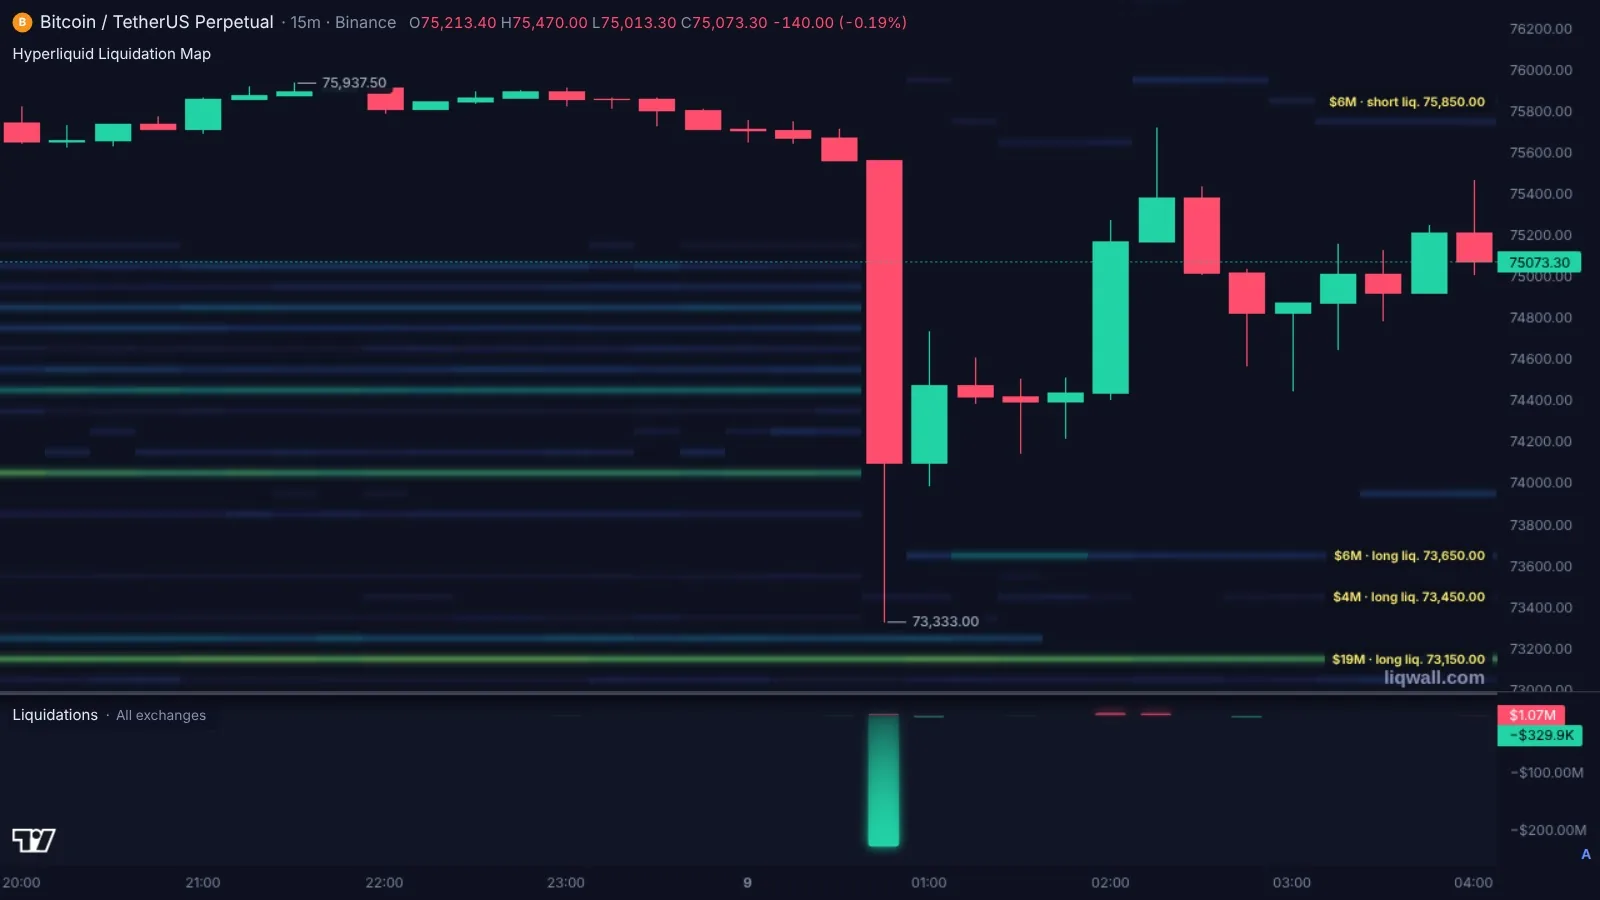
At 00:45 Moscow time sellers broke $75,000. In one 15-minute candle bitcoin went through every band below the price and fell to $73,333, down 3%. Turnover on Binance futures alone in that candle was almost $2B, thirty times the candle before.
From 00:00 to 01:00 Moscow time, $232M of BTC positions were liquidated, and $644M across the market. It was the biggest hour of the day. Over the day, 93% of all market liquidations were longs — the very longs that stood on the map below the price.
On the morning of November 8, at 11:25, our Liqwall | Trading Terminal channel wrote: “Below, from $74,300 to $75,100, there are $115M of long liquidations… below $75,000 the way opens to $74,300.” That night the way opened.
Breakdowns like this come out in the channel every day, free (in Russian).
One exchange or the whole market
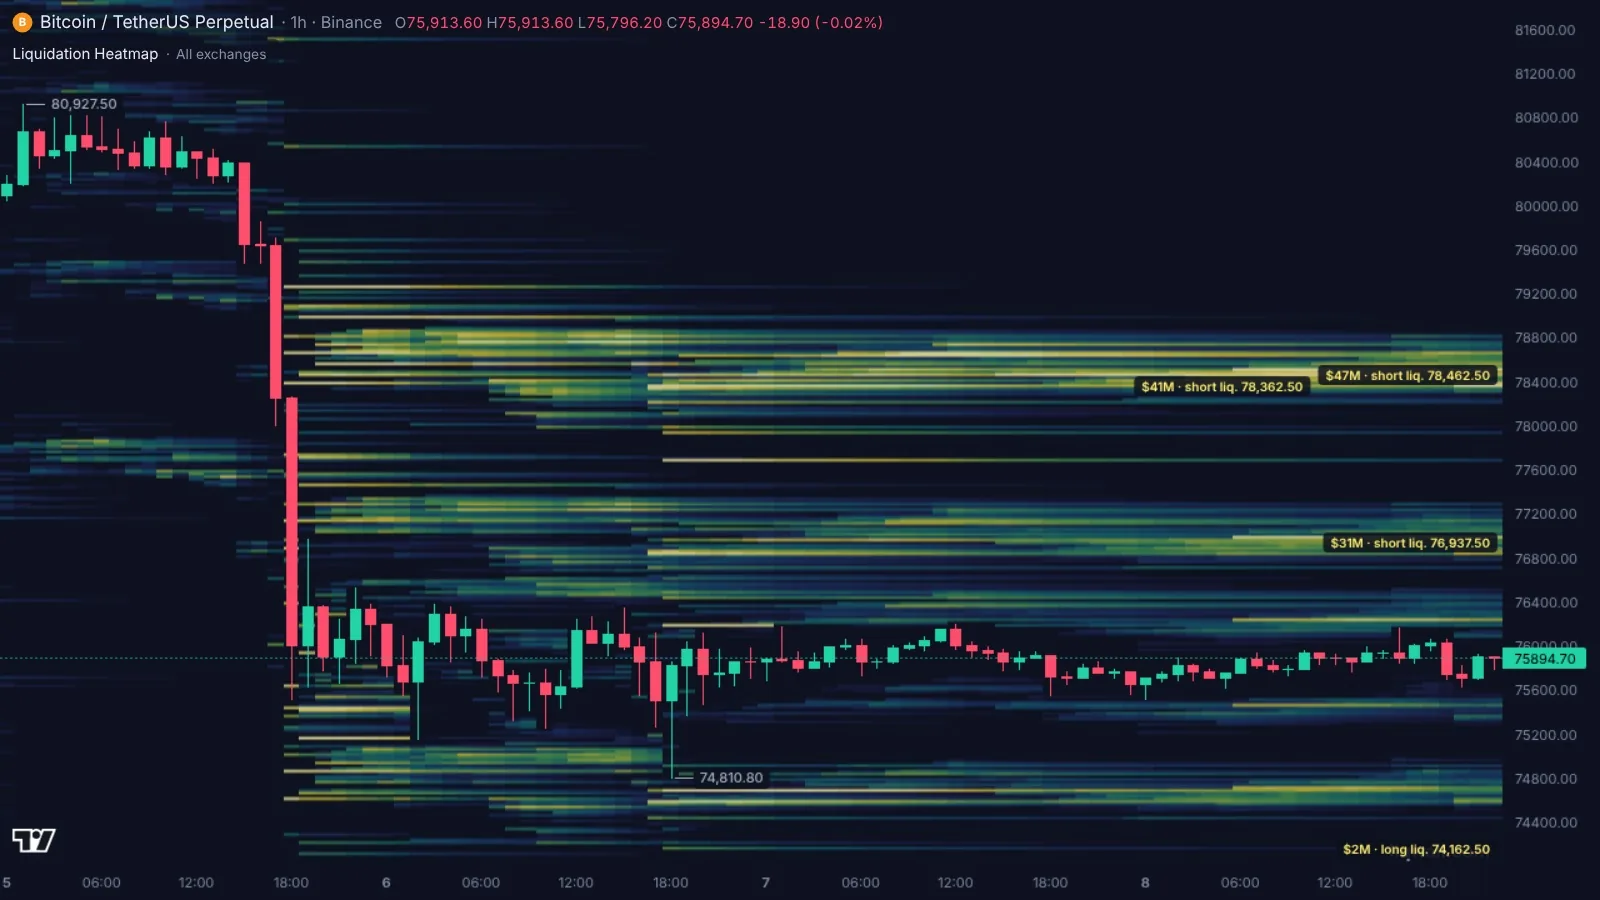
At the same minute, but for the whole market — Binance, Bybit, OKX, Hyperliquid and other exchanges together — the picture was different. Within 2% above the price stood $166M of short liquidations; within 2% below, $105M of longs. Hyperliquid pulled down; the market as a whole pulled up.
Hence the main rule: do not draw a conclusion from one exchange. Traders on different exchanges stand differently. On Liqwall both maps sit side by side, and the liquidation map by exchange shows which exchange holds each level. That evening the largest level below the price was $52.7M at $73,100 on Hyperliquid; above the price, $43.1M at $78,500 on Bybit.
The map by exchange opens right away — no sign-up.
Liquidation map vs liquidation heatmap
- A liquidation map — the levels of one moment: bars by price with an amount on each. It answers “what stands above and below the price right now”.
- A liquidation heatmap — the same levels over time on the price chart. It answers “how the cluster was built and whether the price has already taken it”.
- Liquidations that already happened — how much was closed in an hour or a day. That is the past, not what lies ahead: see liquidations today.
A good tool gives all three. On Liqwall they sit on neighbouring tabs of one page.
Do clusters pull the price?
No, and this is the most common mistake. A liquidation cluster is not a magnet, it is fuel. The map answers another question — what happens if the price gets there. The orders of the liquidated fire at once and speed the move up, as they did on the night of November 9.
So the direction is found not on the liquidation map but in the order book and the trades: who is pressing at market now and which walls stand in the way. The map shows where that push will get reinforcement.
How traders use a liquidation map
- Take-profit targets. A bright cluster in the direction of the trade is where the move can speed up and where it is convenient to take part of the profit.
- Stop placement. Keep your own stop and liquidation price outside bright bands. The crowd stands there, and the price is carried through those levels with it.
- Entry filter. If there is twice as much money below the price as above, a long against that imbalance is taken smaller, or you wait until the cluster is cleared.
- Alerts. Find the level on the map and set an alert on it in the terminal. The message comes to Telegram or the phone when the price gets close, so you do not have to sit at the screen.
The best liquidation heatmaps in 2026: comparison
| Tool | What it gives | Without paying | Full access | Russian |
|---|---|---|---|---|
| Liqwall | Hyperliquid liquidation map for 61 markets (crypto, stocks, gold, oil) built on real positions; liquidation map by exchange; liquidation heatmaps; next to them — order books of all exchanges, Hyperliquid stops and take-profits, whales, alerts and trading from the chart | All maps — right away, no sign-up | The whole terminal — 3 days free right after sign-up | Yes |
| CoinGlass | Liquidation map, liquidation heatmap, Hyperliquid liquidation map | Heatmap — BTC and ETH only, no auto refresh; full map data after login | Prime — $28 a month | Yes |
| Hyblock Capital | Liquidation levels and heatmap, derivatives indicators | Basic plan — no liquidation maps | Advanced — $99 a month | No |
| CoinAnk | Liquidation map and heatmap, Hyperliquid map | Charts do not open without login; liquidation map — VIP only | VIP — $20 a month | Yes |
| The Kingfisher | LiqMap liquidation map, liquidation heatmap | One open bitcoin map | Pro — $79 a month, Max — $109 | Website — yes |
Prices and terms — from the services' official pages as of November 8, 2026.
Liqwall — every liquidation map opens right away, with no sign-up and no payment, in English and Russian. The Hyperliquid map is built on real open positions and covers 61 markets — from bitcoin to stocks, gold and oil. The map by exchange shows which exchange holds each level, and the heatmap shows how the clusters built up over two days. In the terminal, next to liquidations, you have the order books of all exchanges, Hyperliquid stops and take-profits, whales, Telegram alerts and trading from the same chart. For the first 3 days after sign-up the whole terminal is free.
CoinGlass is the best-known service. Its free heatmap covers only BTC and ETH and does not refresh by itself, the full liquidation map opens after login, and the rest is in Prime for $28 a month.
Hyblock Capital — liquidation levels and the heatmap come only with the Advanced plan for $99 a month; the interface is English only.
CoinAnk — charts do not open without login, and the liquidation map is VIP only for $20 a month.
The Kingfisher — one bitcoin map for free; everything else from $79 a month.
Why one liquidation map is not enough
The map shows the fuel, not who strikes the match. A decision is built from three layers.
- The order book. Where large orders stand that can stop the price before the cluster. A sell wall in front of short liquidations can keep the price away from them. More in the guide to the order book heatmap.
- Trades. Who is hitting the market now: buyers or sellers. On the night of November 9 sellers hit so hard that the candle's volume grew thirtyfold.
- Stops. On Hyperliquid you can see stop orders too. Together with liquidations they show everything that will speed up a move: that evening, $17M of sell stops and long liquidations stood at $75,050 and another $17M at $74,750.
In the Liqwall terminal all three layers sit on one chart with the liquidation map. No need to switch between five tabs.
Common mistakes
- Looking at one exchange and taking it for the whole market.
- Expecting the price to always “go for liquidity”.
- Placing your stop inside the brightest band.
- Confusing liquidations that already happened with those waiting ahead.
- Trading the map without the order book: a wall in the way can stop the price long before the cluster.
The liquidation map in Liqwall: open it in a minute
- Open the BTC liquidation map — it works with no sign-up. The tabs on top switch between the Hyperliquid map, the exchange heatmap and the map by exchange.
- Above the map the key numbers are written as text: how much is liquidated within 2% and 10% of the price and where the largest levels are.
- Need another coin — pick it in the list. The Hyperliquid map covers 61 markets, including stocks, gold and oil.
- Want the levels on your own chart — open the terminal and add Hyperliquid Liquidation Map and Liquidation Heatmap. They are live.
- Set an alert on a level — and stop watching the screen.
For the first 3 days after sign-up all of Liqwall is free: Hyperliquid stops and take-profits, whales, walls and every indicator — live.
Every day in the Liqwall | Trading Terminal channel — where the largest liquidation clusters for BTC, ETH and SOL lie, what holds the price and where it goes if the level gives way. Free, in Russian.
SubscribeThe liquidation map, the order book and Hyperliquid stops on one chart. Open the terminal or start with the free map.
Questions and answers
What is a liquidation map?
A map of the prices where exchanges will force-close leveraged positions, with a dollar amount at each price. Long liquidations below the price, short liquidations above.
How do I read a liquidation heatmap?
Find the brightest bands above and below the price, compare which side has more money and which is closer, and look at how the band built up over time. A band the price has reached fades: those positions are already closed.
What is the difference between a liquidation map and a liquidation heatmap?
The map shows the levels of one moment; the heatmap shows the same levels over time on the price chart. The first answers “what stands now”, the second “how it was built and what the price has already taken”.
How accurate is a liquidation map?
The Hyperliquid map on Liqwall is built on real open positions, so its levels are the ones standing right now. The map is alive: traders add margin, close and open, and Liqwall shows how the levels shift.
Does the price always go to liquidation clusters?
No. A cluster is not a magnet, it is fuel. The map shows not the direction but what will speed a move up if the price gets there.
Which liquidation map is best for a beginner?
A free one, in your language, with amounts written as text. The open Liqwall map meets all three: above it, it says how much is liquidated within 2% and 10% of the price and where the largest levels are.
Is there a free liquidation heatmap?
Yes. On Liqwall the Hyperliquid liquidation map, the map by exchange and the liquidation heatmaps open free, with no sign-up. And for the first 3 days after sign-up the whole terminal is free.
How do I place a stop-loss using the liquidation map?
Not inside a bright band but beyond it. The crowd's stops and liquidations stand inside the band: when the price gets there, the move speeds up and knocks out your stop together with everyone else's.
How often does the liquidation map update?
The open Liqwall maps update by themselves, with no page reload. In the terminal the maps are live.